Cotton Fibre Length Measuring Instruments: Principles, Merits and Limitations
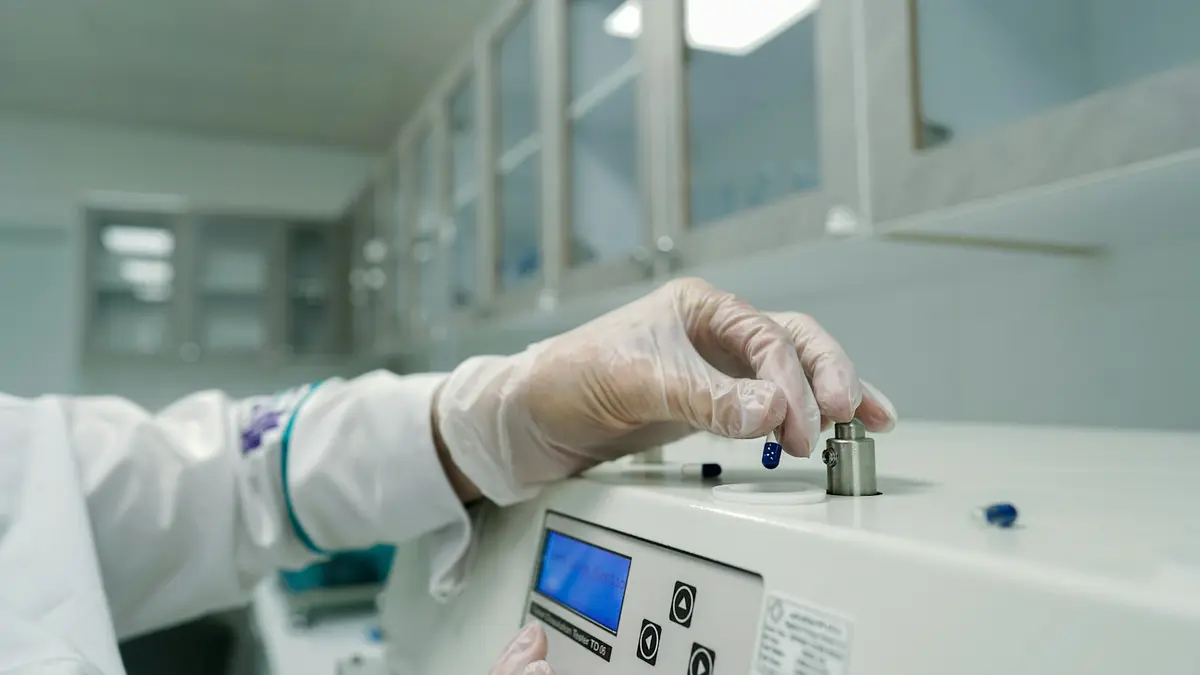
Table of Contents
Merits and Limitations of Cotton Fibre Length Measurement Instruments
Cotton fibre length is not represented by one universal value. A cotton sample contains fibres of many lengths, and each instrument prepares, selects, straightens, clamps or detects those fibres differently. Consequently, results from a Baer sorter, Fibrograph, High Volume Instrument (HVI), Advanced Fibre Information System (AFIS) or image-analysis system may be related without being directly interchangeable.
The main distinction is between methods that construct a physical fibre array and methods that measure an aligned beard or individualised fibres at high speed. Array methods can provide detailed length distributions and are often useful for examining short fibres, but they are slow and operator-dependent. Automated systems provide faster screening and process control, although sampling, fibre breakage, crimp, straightening and calibration can affect reported length values.
Abstract
Cotton fibre-length measurement supports fibre selection, spinning-process planning and quality control. Conventional methods such as the Baer sorter can provide detailed length distributions and useful estimates of short-fibre content, but require careful manual preparation and substantial testing time. Fibrograph-based instruments and HVI systems are much faster because they scan an aligned fibre beard optically, while AFIS measures large numbers of individualised fibres using electro-optical sensing.
No instrument measures an entirely preparation-free sample. Fibre opening can break fibres; beard formation and clamping can favour certain fibre lengths; and incomplete straightening can reduce apparent length. The Peyer Almeter, Fibrograph, HVI, AFIS and image-analysis methods therefore report useful but method-specific indicators. Short-fibre-content values deserve particular care because they depend on the chosen threshold, sample-selection mechanism and calculation method.
Introduction to Cotton Fibre-Length Measurement
Fibre length influences cotton spinning performance. Longer and more uniform fibres generally provide better fibre overlap in yarn, which can support yarn strength and smoother processing. Very short fibres can be difficult to control during opening, carding, drafting and spinning. They may contribute to waste, fly, unevenness, yarn appearance problems and increased end-breakage risk when their proportion becomes excessive.
Length must be interpreted as a distribution rather than a single number. Common reported measures include mean length, upper-half or upper-quarter length, span lengths, uniformity index and short-fibre content. Each describes a different aspect of the same population, and the appropriate measure depends on whether the purpose is classing, bale management, process troubleshooting or research.
This article compares conventional array methods, beard-scanning instruments, high-volume testing, individual-fibre analysis and image-based approaches. It focuses on their principles, reported outputs and the sampling effects that explain why results can differ.
Methods for Measuring Cotton Fibre Length
Oil Plate Method
In the oil plate method, fibres are separated and straightened on a glass plate, commonly with liquid paraffin or another suitable medium, then measured against a scale. Because individual fibres can be visually examined and positioned, the method can provide a direct length assessment.
Its principal merit is careful, observable preparation. However, it is labour-intensive, slow and unsuitable for routine testing of large numbers of lots. Results also depend on the operator’s ability to separate fibres without stretching, breaking or overlooking them.
Balls Sorter
The Balls sorter is a traditional method for obtaining a fibre-length frequency distribution. Fibres are arranged by length on a plush surface, divided into length groups and weighed. The resulting weight-length distribution can be used to calculate mean length and coefficient of variation.
The method offers a distribution-based view rather than a single staple value. Its disadvantages are the time required for preparation and sorting, together with limited practical use in modern high-throughput laboratories.
Baer Sorter and Suter Web Sorter
The Baer sorter is an array method in which parallel combs and a top comb progressively separate fibres into length groups. The operator forms a descending array of fibre ends, from which cumulative length distribution and related parameters can be obtained. Depending on the calculation convention, outputs can include effective length, mean length, upper-quarter length and the proportion of fibres below a selected short-fibre limit.
The related Suter web sorter also separates fibres into length-related groups but uses weighed fibre tufts to derive the distribution. Both approaches are valuable where detailed distribution information is more important than speed. Array-method terminology and procedures should be matched to the currently applicable laboratory standard and local test protocol rather than relying on an outdated standard designation.
Advantages of the Baer Sorter
A carefully prepared Baer sorter array has historically been used as a reference-style assessment of cotton length distribution. Its effective length can show useful correspondence with traditional staple-length assessment, and the method is especially valuable for examining the short-fibre region of a sample.
Because the distribution is physically separated into classes, the method can provide a more transparent basis for short-fibre-content estimation than a rapid indirect index. It is therefore useful for comparative studies and investigations of processing damage.
Limitations of the Baer Sorter
The method is slow, often requiring extensive manual handling for each sample. It also requires trained personnel who can prepare a consistent array, avoid disturbing fibre alignment and apply the selected calculation procedure consistently.
The result should not be treated as an absolute value independent of method. Fibre selection, handling, class width and the chosen short-fibre definition can all influence the reported outcome.
Shirley Photoelectric Stapler
The Shirley photoelectric stapler was an early optical approach to staple-length measurement. An aligned fibre tuft moves through an optical sensing arrangement in which reflected light is monitored by photoelectric cells. The instrument derives a staple-length indicator from the positions associated with major changes in the sensor signals.
Its significance is historical as an example of replacing manual visual judgement with optical detection. As with other beard-based methods, the quality of fibre alignment and sample presentation affects the measurement.
Peyer Almeter
The Peyer Almeter uses a prepared and aligned fibre beard, often formed with a Fibroliner and held in a needle field. Changes in capacitance are used to determine the amount of fibre at successive positions, allowing cumulative and histogram-style length distributions to be generated.
The method can provide more distribution detail than a simple length index, but its preparation is slower than modern high-volume systems. A practical limitation is that very short fibres may not be gripped fully by a finite gauge arrangement. If they shift during measurement, the short-fibre region of the distribution may be affected.
Fibrograph
A Fibrograph measures an aligned fibre beard prepared on a comb. Optical scanning begins near the beard base and proceeds toward the fibre tips, recording the decreasing amount of fibre present at each distance. The resulting curve, called a fibrogram, is used to calculate span lengths, uniformity-related measures and other length indicators.
Fibrograph technology developed from manual and mechanically assisted systems into servo-controlled and digital instruments. Automation reduced test time and improved repeatability, making the principle suitable for routine cotton evaluation. However, the fibrogram represents the prepared beard, not necessarily an undisturbed numerical sample of every fibre in the original tuft.
Advantages of the Fibrograph
A Fibrograph produces length-related data rapidly and can be less dependent on subjective visual judgement than manual sorting methods. The prepared beard is intended to resemble fibres held at a drafting-system nip, making the information relevant to spinning-oriented assessment.
The method also provides standardised indicators that can be compared within a consistent testing system. This makes it useful for lot screening, trend monitoring and quality communication when procedures are controlled.
Limitations and Sampling Precautions for the Fibrograph
Breakage during preparation, crimp not fully removed during alignment and the length held within the clamp can reduce apparent fibre length. Scan direction and the precise reference point used for the beard base can also influence calculated span lengths and uniformity index.
Short-fibre-content estimation requires caution. A beard may not represent all fibre lengths with equal probability, and a derived short-fibre value can differ from one obtained by physical sorting. Good preparation practice includes controlled pressure, gentle sampler handling, a uniform beard, fresh sample surfaces and limited brushing. Excessive brushing or repeated manipulation can change the sample being measured.
Short-Fibre Content Measurement
Short-fibre content (SFC) is commonly expressed as the percentage of fibres or fibre mass below a specified length. The selected threshold varies by instrument, calculation method and commercial practice. In some contexts, SFC is related to a sorter-derived effective-length criterion rather than a fixed millimetre value.
Sorter methods can provide a detailed basis for SFC estimation because they separate length classes physically. Digital Fibrograph and HVI systems offer much faster reporting, but their SFC indicators should be interpreted as instrument-specific unless validated against the relevant reference method. Uniformity index alone is not a substitute for SFC: two cottons can have similar uniformity values while differing in their short-fibre populations.
High-Volume Instrument Testing
High-volume instruments extend the digital Fibrograph principle into rapid, standardised cotton testing. They are designed for large-scale quality evaluation and can support bale-by-bale screening alongside other physical properties such as strength, micronaire and colour.
For length measurement, an HVI prepares an aligned beard and optically determines parameters such as upper-half mean length and uniformity index. Reliable inter-laboratory use depends on disciplined maintenance, controlled environmental conditions, approved calibration materials and current operating procedures.

Source: Pexels
Limitations of High-Volume Instrument Length Testing
The speed of HVI preparation is a major operational advantage, but high-speed combing can damage harsh, entangled or fragile cotton. Breakage, incomplete straightening and clamp-related effects may lower the measured length or alter the apparent distribution.
HVI beard sampling may be interpreted as numerical or length-biased depending on the preparation mechanism and the cotton population. This distinction becomes more important when length variability is high. Differences between HVI, AFIS and sorter values can therefore arise from sampling distribution, fibre breakage, straightening, calibration and the specific length parameter being compared.
Projecting-Fibre Sample Method
The projecting-fibre sample method attempts to estimate a whole-sample length distribution from fibres extending from a Fibrograph comb. It recognises that the visible beard is a selected population rather than a simple random collection of fibres.
This approach can provide useful distribution estimates, but agreement is usually weaker in the short-fibre region. Random clamping and unequal fibre-selection probability can increase variation in the projecting beard compared with the original material.
Advanced Fibre Information System (AFIS)
AFIS opens fibre tufts into individual fibres and presents them to electro-optical sensors. Instead of measuring one aligned beard, it records data from a large number of fibres and reports mean values and distributions. Depending on the system configuration, length information can be considered alongside fineness, maturity-related or nep-related data.
AFIS is particularly useful for analysing fibre populations and detecting changes caused by processing. Instrument calibration and verification should follow the manufacturer’s current procedures and the laboratory’s quality system.
Advantages of AFIS
AFIS avoids manual array preparation and can measure many fibres within a short test period. Its individual-fibre approach supports numerical distributions, and when length is combined with diameter or fineness information, weight-related distributions can also be derived.
The method can reveal features that a beard-average measurement may conceal, including broad distributions or multiple length populations. This is valuable when investigating ginning damage, carding effects or variation between bale components.
Limitations of AFIS
Fibre opening is not neutral: longer or more entangled fibres may break during separation, reducing the measured length. Fibres may also remain curved or insufficiently straightened while passing the sensing zone, causing underestimation.
Therefore, AFIS data should be compared with other instruments by considering the parameter definition and sample-preparation route, not by assuming that all reported mean lengths have the same meaning.
Image Analysis for Fibre-Length Measurement
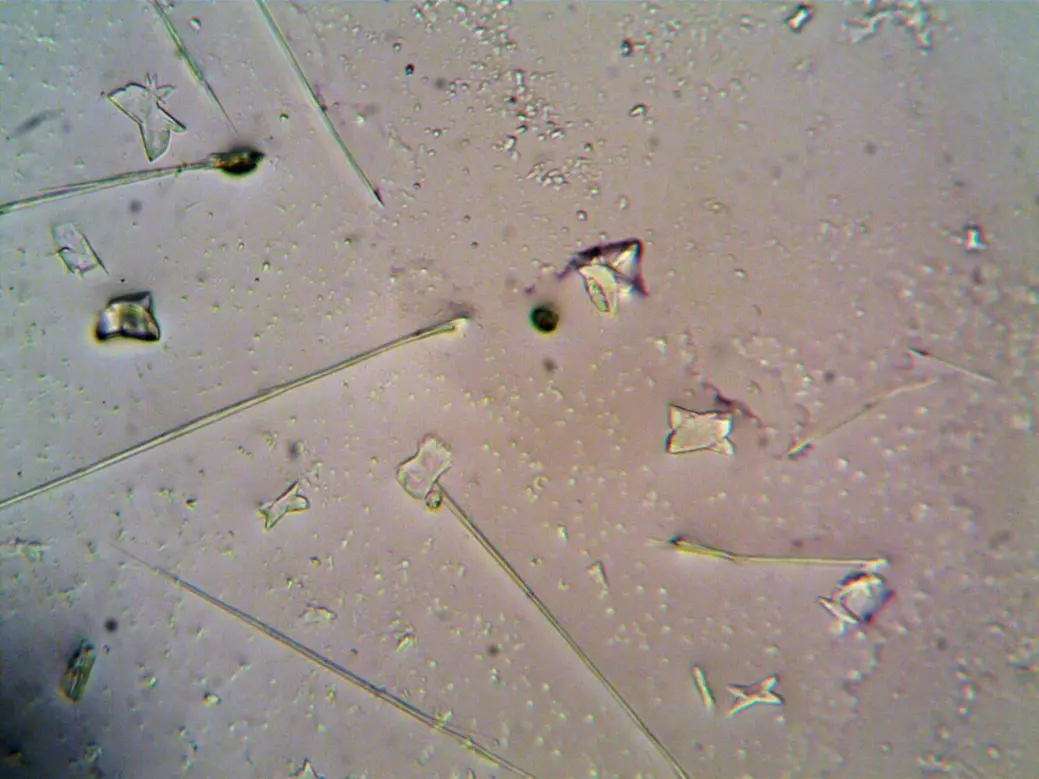
Image analysis measures fibres placed on a glass slide or another imaging surface. A camera captures the fibres, and software identifies fibre paths, endpoints and lengths. The technique can be applied to separated fibres or, with more complex segmentation, to aligned fibre tufts.
Source: Pexels
Accuracy depends strongly on lighting, contrast, camera resolution, focus, fibre overlap, image preprocessing and the algorithm used to trace curved fibres. High-resolution imaging can reduce manual measurement effort and provide detailed visual verification, but slide preparation and image processing can be time-consuming. Reported agreement with sorter, Almeter or AFIS measurements should be treated cautiously because comparison quality depends on sample preparation and the calculation basis.
Numerical and Length-Biased Mean Length
A numerical distribution gives each fibre equal probability of selection. If there are 100 fibres in a sample, each fibre contributes one observation regardless of length. This basis is natural for an individual-fibre system such as AFIS when opening and detection do not preferentially lose a fibre class.
A length-biased distribution gives longer fibres a greater chance of appearing in the measured population. In a beard-forming system, a longer fibre may have a greater probability of being captured or extending from a clamp. A length-biased frequency distribution can be derived conceptually by multiplying each numerical length-class frequency by its fibre length and then normalising the result.
Length-biased distributions generally produce a higher mean length and may produce lower apparent short-fibre content than the corresponding numerical distribution. Understanding this distinction is essential before comparing values from beard-based and individual-fibre instruments.
Comparing Results from Different Fibre-Length Instruments
Agreement between instruments is strongest when the same physical concept is being compared and when sampling, calibration and preparation are well controlled. Mean-length measures may show practical correlation across methods, but span lengths, effective lengths, upper-quarter values and numerical means are not identical quantities. The short-fibre region commonly shows weaker agreement because it is sensitive to breakage, clamping, threshold selection and fibre-selection probability.
Baer and Suter-type sorting methods provide detailed distribution information but trade speed for manual work. HVI provides rapid commercial screening and consistent operational indicators. AFIS provides high-throughput individual-fibre information but can be affected by opening damage and straightening. Almeter and image-analysis methods can produce rich distributions, although their practical utility depends on preparation time and analytical control.
Cotton type also matters. Samples with wide length variation, substantial processing damage, high crimp or entanglement may show larger differences between methods. AFIS may sometimes show broad or apparently bimodal distributions; these patterns can reflect mixed fibre populations, maturity-related differences, processing breakage or measurement effects and should be investigated rather than accepted automatically.
For mill decisions, the most useful practice is to trend each instrument’s outputs consistently, use the same parameter definitions for supplier comparisons and investigate unexpected differences with a distribution-based method. Fibre-length distribution remains important because it affects yarn strength, irregularity, waste, processing stability and bale selection, but no single instrument value fully describes spinning performance.